Global Visual Analytics Market Size, Share, and COVID-19 Impact Analysis, By Service (Managed Services, Professional Services), By Deployment (On-Premise, On-Demand), By End-Users (Healthcare, BFSI, IT & Telecom, Retail & Consumer Goods, Education), and By Region (North America, Europe, Asia-Pacific, Latin America, Middle East, and Africa), Analysis and Forecast 2023 – 2033
Industry: Information & TechnologyGlobal Visual Analytics Market Insights Forecasts to 2033
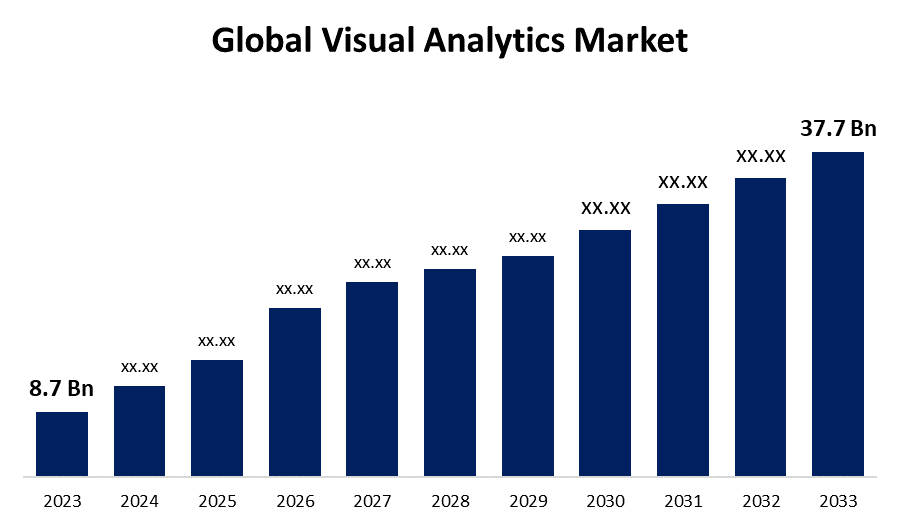
- The Global Visual Analytics Market Size was Valued at USD 8.7 Billion in 2023.
- The Market Size is Growing at a CAGR of 15.79% from 2023 to 2033.
- The Worldwide Visual Analytics Market Size is Expected to Reach USD 37.7 Billion by 2033.
- Asia Pacific is expected to grow the fastest during the forecast period.
Get more details on this report -
The Global Visual Analytics Market Size is Anticipated to Exceed USD 37.7 Billion by 2033, Growing at a CAGR of 15.79% from 2023 to 2033.
Market Overview
Visual analytics is the study of datasets utilizing data visualizations through the application of advanced tools and procedures. Using tables, graphs, and maps to visualize the data enables users to detect trends and produce insights that can be put into practice. These insights support firms in making more informed decisions based on data. Technological developments, the growing need for real-time data analysis, and the amount and variety of data being generated are the main drivers of market growth. Players in the market are concentrating on producing new software as a result, which is going to encourage market expansion. For example, Microsoft Inc. released a new edition of Power BI (Business Intelligence) Workspace in June 2022. The most recent version offers several improvements, such as the capacity to generate paginated reports and improved efficiency and data modeling capabilities. Users may produce visuals and groups of visuals with Power BI Desktop, which can then be shared as presentations with other members of their business. Furthermore, the increasing demand for forecast and statistical analysis tools is driving the need for visual analytics solutions. Organizations in a variety of industries, including healthcare, finance, and retail, rely on visual analytics tools to predict future trends and evaluate historical information.
Report Coverage
This research report categorizes the market for the global visual analytics market based on various segments and regions forecasts revenue growth and analyzes trends in each submarket. The report analyses the key growth drivers, opportunities, and challenges influencing the global visual analytics market. Recent market developments and competitive strategies such as expansion, product launch, and development, partnership, merger, and acquisition have been included to draw the competitive landscape in the market. The report strategically identifies and profiles the key market players and analyses their core competencies in each sub-segment of the global visual analytics market.
Global Visual Analytics Market Report Coverage
| Report Coverage | Details |
|---|---|
| Base Year: | 2023 |
| Market Size in 2023: | USD 8.7 Billion |
| Forecast Period: | 2023-2033 |
| Forecast Period CAGR 2023-2033 : | 15.79% |
| 2033 Value Projection: | USD 37.7 Billion |
| Historical Data for: | 2019-2022 |
| No. of Pages: | 200 |
| Tables, Charts & Figures: | 115 |
| Segments covered: | By Service, By Deployment, By End-Users, By Region |
| Companies covered:: | Geckoboard Software, DataDeck, Microsoft Corporation, SAS Institute Inc., Ubiq, Data Clarity, Tableau Software Inc., IBM Corporation, Locii Solutions Ltd., Oracle Corporation, MicroStrategy Incorporated, G IBM Corporation, SAP, TIBCO Software, Qlik, Alteryx, and other key companies. |
| Pitfalls & Challenges: | Covid-19 Empact,Challenges,Growth, Analysis. |
Get more details on this report -
Driving Factors
Visual analytics solutions are also being used increasingly often in the healthcare sector. The need to assess huge amounts of medical data and provide findings to improve the treatment of patients is driving the market for visual analytics solutions. The growing need for personalized treatment and the growing adoption of electronic health records are the other factors driving market revenue growth. The use of cloud computing is growing in the visual analytics business. This is because cloud-based visual analytics systems offer numerous advantages, including cost-effectiveness, adaptability, and flexibility. Organizations with varying data amounts can benefit greatly from cloud-based visual analytics solutions, which enable them to scale their visual analytics capabilities up or down as needed. Because they can be accessible from any location with an internet connection, cloud-based visual analytics solutions are thus typically more versatile than solutions that are installed on-premises. Furthermore, since companies do not need to invest in the technology and software required for operating an on-premises visual analytics approach cloud-based solutions can often be cheaper than on-premises choices.
Restraining Factors
The visual analytics market growth is currently constrained by several factors. These include the high cost associated with installation and the prevalent security concerns that potential users face. Additionally, the lack of skilled professionals proficient in visual analytics technologies presents a significant hurdle to industry advancement. Improper design issues leading to confusion in communication are anticipated to obstruct the visual analytics deployment. It is anticipated that a lack of appropriate governance and inconsistent data will make things difficult for the visual analytics system.
Market Segmentation
The global visual analytics market share is classified into service, deployment, and end-users.
- The managed services segment is expected to grow at the fastest pace in the global visual analytics market during the forecast period.
Based on the service, the global visual analytics market is divided into managed services and professional services. Among these, the managed services segment is expected to grow at the fastest pace in the global visual analytics market during the forecast period. Better business decisions are made possible by managed analytics services, which offer actual business insights and help organizations find key performance indicators (KPIs) within data. Managed analytics solutions allow businesses to lower the Total Cost of Ownership (TCO) while facilitating rapid immediate use of data and real-time operations.
- The on-demand segment is expected to grow at the fastest pace in the global visual analytics market during the forecast period.
Based on the deployment, the global visual analytics market is divided into on-premise, and on-demand. Among these, the on-demand segment is expected to grow at the fastest pace in the global visual analytics market during the forecast period. Businesses with varying volumes of data can benefit greatly from on-demand visual analytics systems, which offer the flexibility to scale up or down as needed. Businesses have more flexibility with on-demand visual analytics solutions since they can be accessible from any location with an internet connection. Businesses requiring access to visual analytics services from any location or with varying data quantities may consider on-demand solutions.
- The healthcare segment is expected to hold the largest share of the global visual analytics market during the forecast period.
Based on end-users, the global visual analytics market is divided into healthcare, BFSI, IT & telecom, retail & consumer goods, and education. Among these, the healthcare segment is expected to hold the largest share of the global visual analytics market during the forecast period. To optimize patient care and increase efficiency in operations, the healthcare sector has primarily depended on these technologies to make decisions based on data. By interpreting images of data obtained through medical imaging, visual analytics assist medical professionals in diagnosing a variety of disorders. The regulatory framework in the healthcare industry drives the acceptance of visual analytics for improved observance and consistent reporting.
Regional Segment Analysis of the Global Visual Analytics Market
- North America (U.S., Canada, Mexico)
- Europe (Germany, France, U.K., Italy, Spain, Rest of Europe)
- Asia-Pacific (China, Japan, India, Rest of APAC)
- South America (Brazil and the Rest of South America)
- The Middle East and Africa (UAE, South Africa, Rest of MEA)
North America is anticipated to hold the largest share of the global visual analytics market over the predicted timeframe.
North America is anticipated to hold the largest share of the global visual analytics market over the predicted timeframe. As a result, the region has a strong IT infrastructure that easily facilitates the integration of visual analytics applications. Many applications in the healthcare, banking, and technology industries are available in North America for the use of visual analytics. This is defined as the development of new business models, the rapid acceptance of big data, business intelligence (BI), and related technologies by end users, and technological breakthroughs that are all favorably influencing market expansion. Because of the established economies in the region especially the United States and Canada which place a high value on technological advancements and discoveries from research and development, North America is predicted to have the largest revenue share over the projected period.
Asia Pacific is expected to grow at the fastest pace in the global visual analytics market during the forecast period. Countries that are developing like China, Japan, Singapore, India, and others are investing more money in R&D projects. The Asia Pacific visual analytics market is driven by the region's large number of manufacturing companies that are implementing innovative technologies.
Competitive Analysis:
The report offers the appropriate analysis of the key organizations/companies involved within the global visual analytics along with a comparative evaluation primarily based on their product offering, business overviews, geographic presence, enterprise strategies, segment market share, and SWOT analysis. The report also provides an elaborative analysis focusing on the current news and developments of the companies, which includes product development, innovations, joint ventures, partnerships, mergers & acquisitions, strategic alliances, and others. This allows for the evaluation of the overall competition within the market.
List of Key Companies
- Geckoboard Software
- DataDeck
- Microsoft Corporation
- SAS Institute Inc.
- Ubiq
- Data Clarity
- Tableau Software Inc.
- IBM Corporation
- Locii Solutions Ltd.
- Oracle Corporation
- MicroStrategy Incorporated
- G IBM Corporation
- SAP
- TIBCO Software
- Qlik
- Alteryx
- Others
Key Target Audience
- Market Players
- Investors
- End-users
- Government Authorities
- Consulting And Research Firm
- Venture capitalists
- Value-Added Resellers (VARs)
Recent Developments
- In February 2024, TIBCO has earned more than 40 G2 badges, proving its recognized and validated leadership in the Data Management and Integration domains. Just in the first quarter of 2024, TIBCO obtained 18 badges in these particular domains. However, most of these badges were categorized as "Leader" badges, the highest honor granted by G2, highlighting TIBCO's unmatched superiority in its product performance.
- In August 2023, springML, a firm specializing in AI, cloud-based data engineering, and analytics services, revealed its merger with Egen, a company known for expertise in cloud migration, application modernization, and platform engineering.
Market Segment
This study forecasts revenue at global, regional, and country levels from 2020 to 2033. Spherical Insights has segmented the global visual analytics market based on the below-mentioned segments:
Global Visual Analytics Market, By Service
- Managed Services
- Professional Services
Global Visual Analytics Market, By Deployment
- On-Premise
- On-Demand
Global Visual Analytics Market, By End-Users
- Healthcare
- BFSI
- IT & Telecom
- Retail & Consumer Goods
- Education
Global Visual Analytics Market, By Region
- North America
- US
- Canada
- Mexico
- Europe
- Germany
- Uk
- France
- Italy
- Spain
- Russia
- Rest of Europe
- Asia Pacific
- China
- Japan
- India
- South Korea
- Australia
- Rest of Asia Pacific
- South America
- Brazil
- Argentina
- Rest of South America
- Middle East & Africa
- UAE
- Saudi Arabia
- Qatar
- South Africa
- Rest of the Middle East & Africa
Frequently Asked Questions (FAQ)
-
1. Which region holds the largest share of the global visual analytics market?North America is anticipated to hold the largest share of the global visual analytics market over the predicted timeframe.
-
2. What is the market growth rate of the global visual analytics market?The market size is growing at a CAGR of 15.79% from 2023 to 2033.
-
3. What is the market size of the global visual analytics market?The global visual analytics market is expected to grow from USD 8.7 Billion in 2023 to USD 37.7 Billion by 2033, growing at a CAGR of 15.79% from 2023 to 2033.
-
4. Which are the key companies that are currently operating within global visual analytics market?Geckoboard Software, DataDeck, Microsoft Corporation, SAS Institute Inc., Ubiq, Data Clarity, Tableau Software Inc., IBM Corporation, Locii Solutions Ltd., Oracle Corporation, MicroStrategy Incorporated, IBM Corporation, SAP, TIBCO Software, Qlik, Alteryx, And Others.
Need help to buy this report?