Augmented Intelligence in the US - Market Research Report (2020-2035)
Industry: Information & TechnologyAugmented Intelligence in the US – Market Research Report (2020-2035)
|
Market Revenue |
Profit |
Employees |
Businesses |
|
$7.180 bn |
xx |
xx |
xx |
Augmented Intelligence in the US industry analysis
The U.S. Augmented Intelligence Market has seen rapid expansion in recent years, reflecting the broader technological shift and enterprise demand for AI-enhanced decision-making. Key drivers of this growth include the rise of big data, widespread adoption of cloud computing, and increasing demand for intelligent automation across industries such as healthcare, finance, manufacturing, and defense. The strengths such as a robust innovation ecosystem, advanced technological infrastructure, a highly skilled workforce, strong academic-industry collaboration, and substantial public and private sector investments, fostering rapid development and advancements. Opportunities abound in expanding AI applications, particularly in sectors aiming to improve productivity and decision-making processes. U.S. government initiatives focus on promoting innovation, reducing regulatory barriers, and ensuring ethical AI deployment through policies like Executive Order 14179 and the appointment of Chief AI Officers across federal agencies. Recent performance reveals strong growth and heightened investment activity, though the sector faces challenges around privacy, implementation costs, and talent availability. The market has grown at an estimated CAGR of 21.14% through the end of 2024 to reach approximately $7.180 billion, up from $5.927 billion in 2023. With continued advancements in AI and increased cross-sector adoption, the industry is projected to maintain this growth trajectory, aiming for $59.22 billion by 2035.
Trends and Insights:
- Enterprise Digital Transformation is Driving Adoption. Organizations across industries are integrating augmented intelligence solutions to enhance decision-making, automate workflows, and increase operational efficiency, especially in finance, healthcare, and retail.
- Human-Centric AI is Gaining Traction. Unlike fully autonomous AI, augmented intelligence emphasizes human-AI collaboration, supporting professionals rather than replacing them. This model is increasingly favored for its ethical implications and practical applicability.
- Investment and Innovation are Accelerating. With U.S. companies attracting the majority of global AI and cloud funding, with a surge in R&D, start-up activity, and product innovation around augmented intelligence tools.
- Government Initiatives & Competitive Landscape. U.S. government initiatives are promoting AI research and development, creating a favourable environment for innovation and adoption. Additionally, established technology companies and innovative start-ups foster a competitive environment that drives continuous improvement and innovation in augmented intelligence solutions
Industry Statistics and Trends
Industry revenue is expected to grow at a CAGR of 21.14% over the forecast period, to reach an estimated $59.22 bn in 2035.
Industry Outlook
Market size is projected to grow during the forecast period from 2024 to 2035.
Top Key Players in Augmented Intelligence in the US
|
Company |
Market Share (%) 2024
|
Revenue ($short_0) 2024
|
Profit ($short_0) 2024
|
Profit Margin (%) 2024
|
|
NVIDIA |
~61% |
xx |
xx |
~48.8% |
|
Microsoft |
~16% |
~$245.1 |
xx |
~35.0% |
|
IBM |
~10% |
~$60.5 |
xx |
~7.2% |
|
Google (Alphabet Inc.) |
XX% |
XX |
xx |
XX% |
|
Amazon Web Services (AWS |
XX% |
XX |
xx |
XX% |
|
Salesforce |
XX% |
XX |
xx |
XX% |
|
Oracle |
XX% |
XX |
xx |
XX% |
|
Intel |
XX% |
XX |
XX |
XX |
|
Adobe |
XX% |
XX |
XX |
XX |
|
Apple |
XX% |
XX |
XX |
XX |
|
SAS Institute |
XX% |
XX |
XX |
XX |
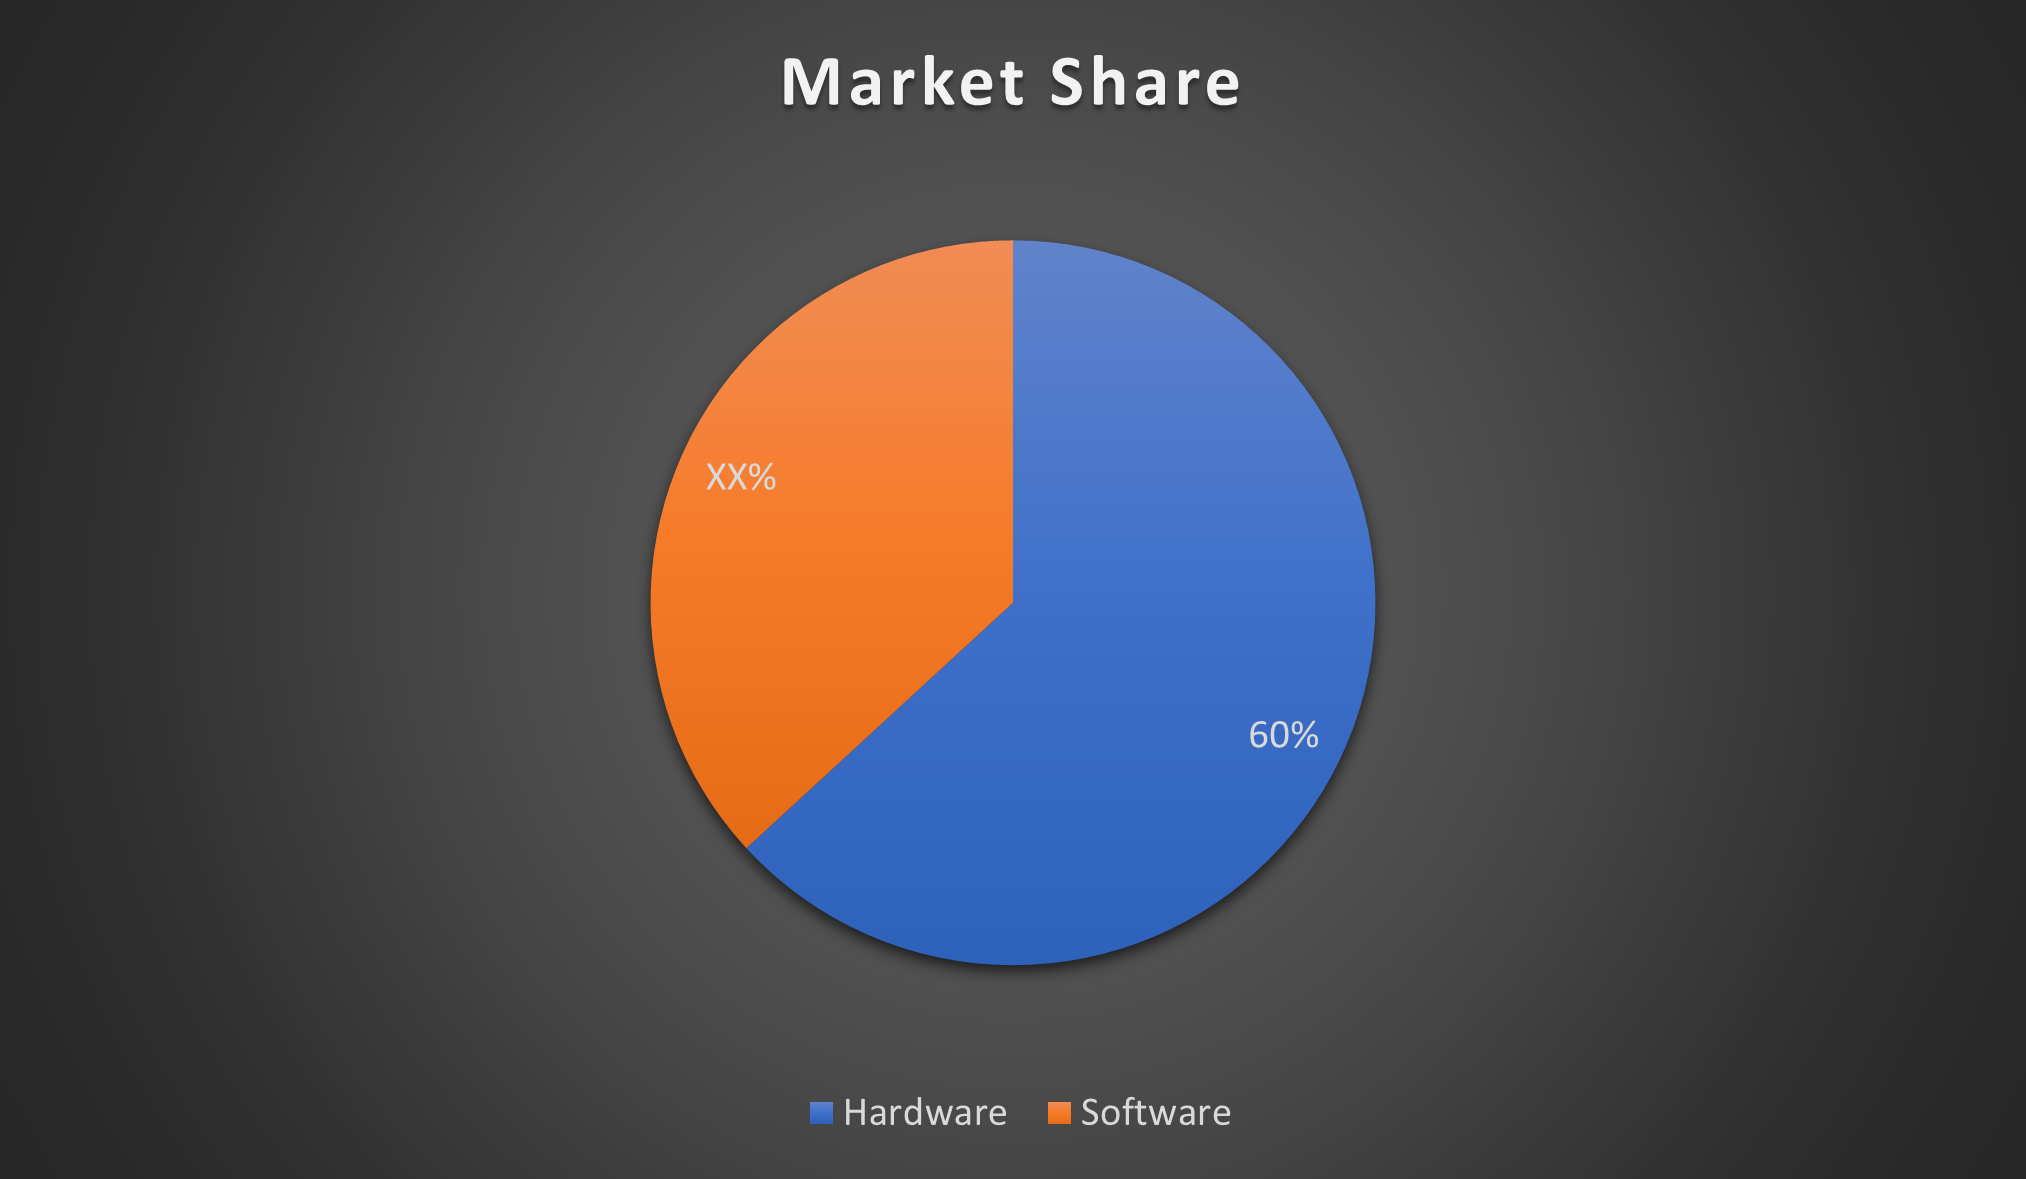
Component & Technology Segmentation: Product and Services
- By Component:
Get more details on this report -
Industry revenue is measured across several distinct product and services lines, including Hardware and Software. Hardware is the largest segment of the Augmented Intelligence in the US. This is driven by high demand for AI chips and GPUs essential for AI training and real-time processing. While software rapidly grows, its performance depends on powerful hardware.
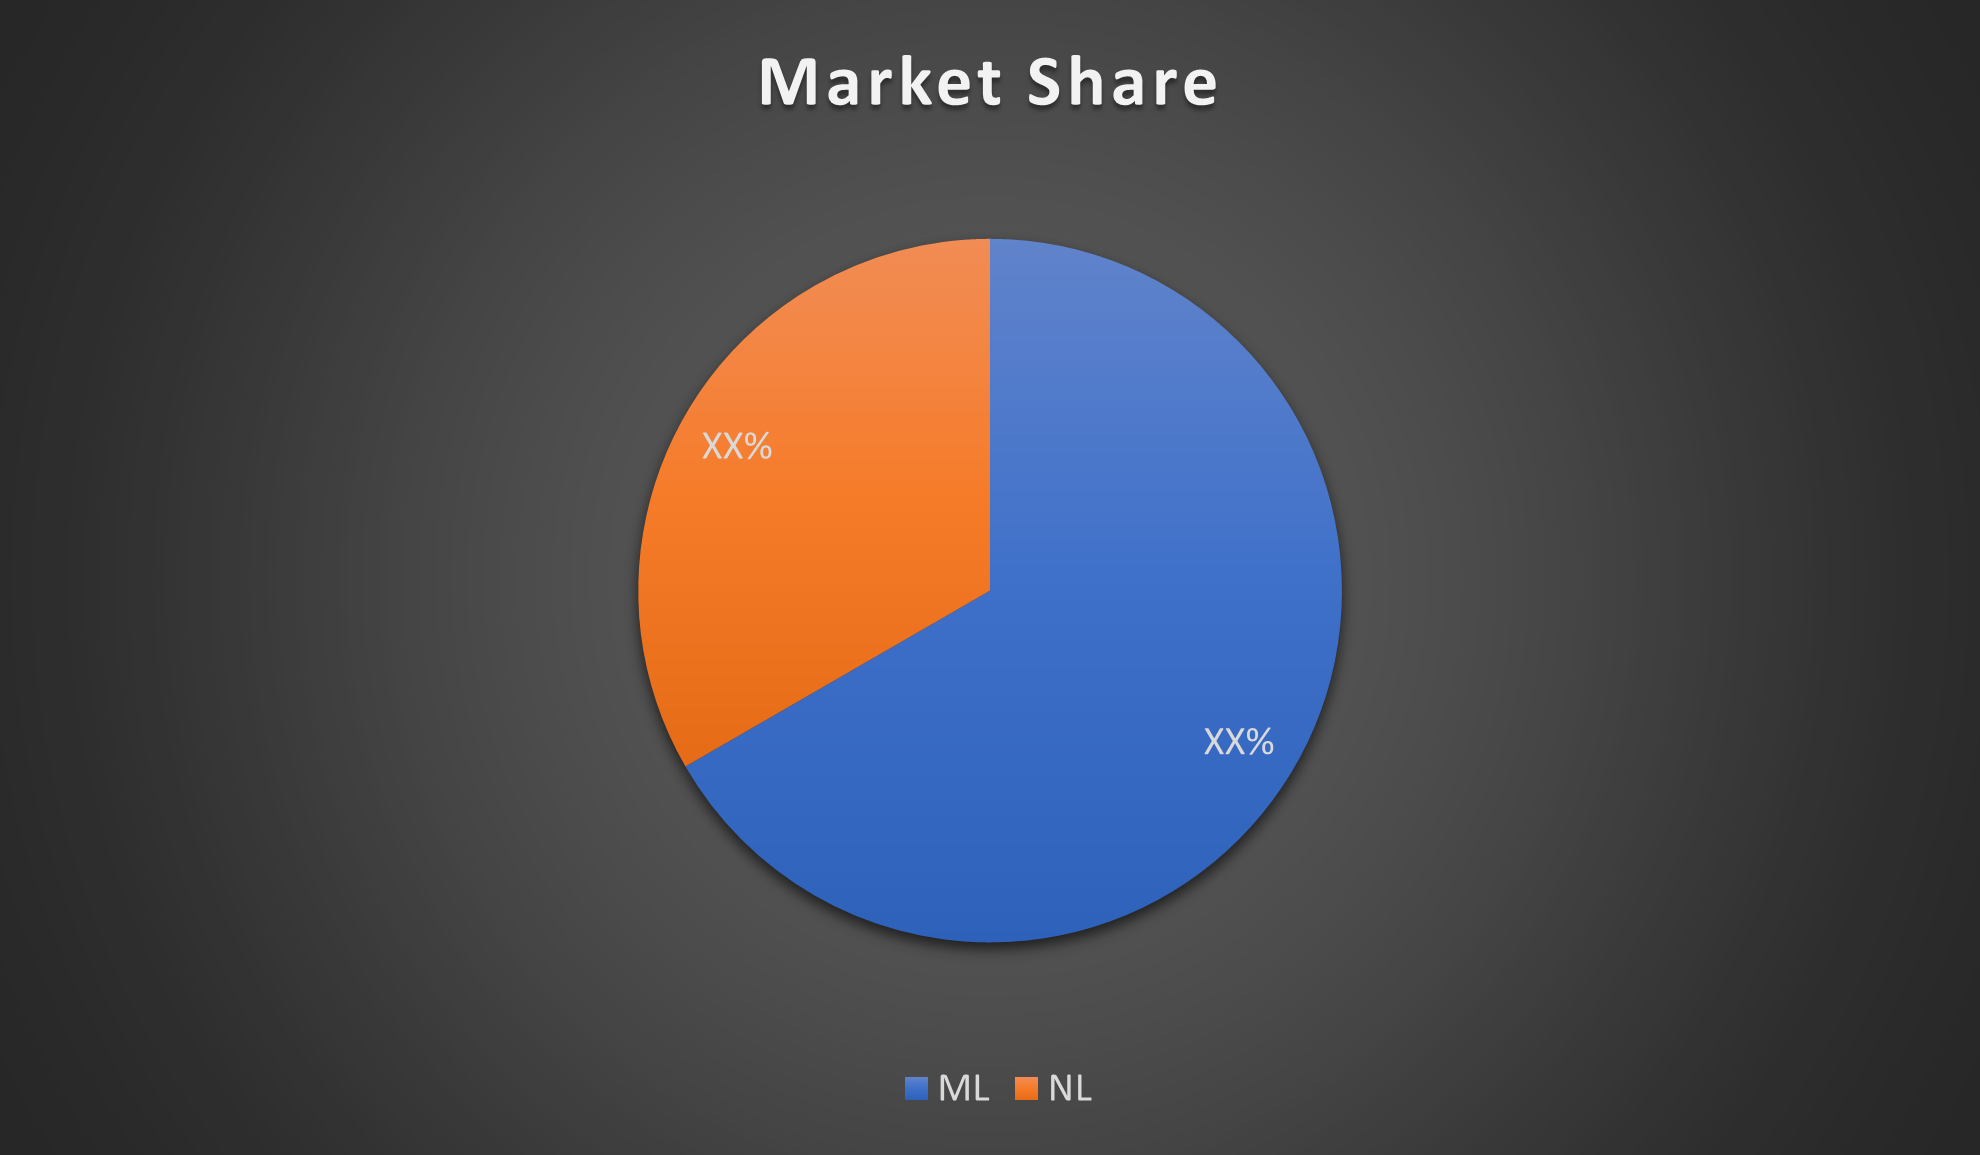
- By Technology:
Get more details on this report -
Industry revenue is measured across several distinct product and services lines, including Machine Learning (ML) and Natural Language Processing (NLP). ML is the largest segment of the Augmented Intelligence in the US. This growing rapidly due to the demand for conversational AI and language-based applications. ML’s broad applicability across industries secures its leading position in the market.
Table of Contents
Chapter 1: Industry Analysis
Industry definition:
Augmented Intelligence refers to the use of advanced technologies, such as machine learning, natural language processing, and AI-driven analytics, to enhance human decision-making and performance. Unlike fully autonomous AI, it emphasizes collaboration between humans and machines, augmenting human intelligence with computational power to improve efficiency, accuracy, and insights across various industries.
What's included in this industry:
The Augmented Intelligence industry includes AI-powered hardware (chips, GPUs), software (ML platforms, NLP tools, analytics), and services that enhance human decision-making. It spans applications in healthcare, finance, retail, and more, integrating technology to boost productivity and insight accuracy.
Chapter-2: Performance
In this chapter
- Current Performance
- Outlook
- Volatility
- Life Cycle
Key Points
- Annual Revenue, Recent Growth, Forecast
- Number of Employees, Recent Growth, Forecast
- Number of Businesses, Recent Growth, Forecast
- Total Profit, Profit Margin, Profit per Business
Charts
- Revenue, including historical (2020-2024) and forecast (2025-2035)
- Employees, including historical (2024)
- Profit, including historical (2020-2024)
- Industry Volatility vs. Revenue Growth
- Industry Life Cycle
Detailed analysis
- Trends in the market and current events that are leading current industry performance
- Expected trends, economic factors, and ongoing events that drive the industry's outlook
- Key success factors for businesses to overcome volatility
- Innovation & Advancements, consolidation, and technology and systems influence the industry's life cycle phase.
Chapter-3: Products and Markets
In this chapter
- Products & Services
- Major Markets
Key metrics
- Largest market segment and value in 2024
- Product innovation level
Charts
- Products & services segmentation in 2024
- Major market segmentation in 2024
Detailed analysis
- Trends impacting the recent performance (growth) of the industry's various segments
- Innovations (advancements) in the industry's product or service offering, specialization, or delivery method
- Key factors that successful businesses consider in their offerings
- Buying segments and key trends influencing demand for industry products and services
Chapter 4: Competitive Forces
In this chapter
- Competitive Rivalry
- Barriers to Entry
- Substitutes
- Bargaining Power of Buyer & Supplier Analysis
Key Metrics
- Industry competitive rivalry level
- Industry competition level and trend
- Restrained to entry level and trend
- Substitutes level and trend
- Buyer power level and trend
- Supplier power level and trend
Charts
- Market share among the top 5 suppliers from 2020-2024
- Supply chain including upstream supplying industries and downstream buying industries, flow chart
Chapter-5: Companies
In this chapter
- Market Share
- Companies
Charts
- Industry market share by company in 2024
- Major companies in the industry, including market share, revenue, profit, and profit margin in 2024
- Company Overview, Established Year, Key Presence, Top Products, and Key Competitors
Chapter 6: External Environment
In this chapter
- External Drivers
- Regulation & Policy
- Pestle Analysis
Need help to buy this report?