Top 30 Companies in the Global Flowchart and Diagramming Tools Market (2024–2035): Spherical Insights Analysis
RELEASE DATE: Apr 2026 Author: Spherical InsightsRequest Free Sample Speak to Analyst
Description
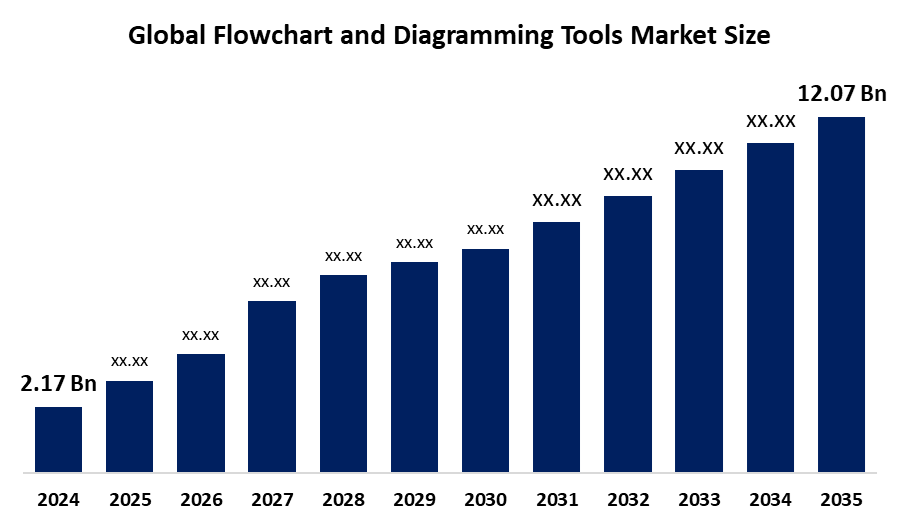
According to a research report published by Spherical Insights & Consulting, the Global Flowchart and Diagramming Tools Market Size is projected to grow from USD 2.17 billion in 2024 to USD 12.07 billion by 2035, at a CAGR of 16.88% during the forecast period 2024–2035. Market expansion stems from the surge in remote work, which demands seamless visual collaboration across distributed teams. Furthermore, the rise of AI-driven automation and the widespread adoption of cloud-based suites in corporate and academic sectors remain major growth catalysts.
Introduction
Flowcharts and diagramming tools are really helpful in making organisational data and workflows easy to understand through visual representations. They have come a long way from just being static drawing tools to cloud-based platforms that use Artificial Intelligence. These platforms can automatically generate layouts. Allow multiple users to work together in real-time. They are used in different areas such as mapping software architecture, and designing user experiences. They are also used to improve supply chain management across industries. The growth of these tools is being helped by government plans like India's Business Reforms Action Plan 2026 and the 2025 Implementation Plan for Data and Digital Government Strategy. These plans focus on improving infrastructure and documentation to make administration more efficient. The main benefit of these tools is that they help avoid mistakes and miscommunications. They provide a clear visual representation that helps different teams work together more effectively, even in a rapidly changing global market. Flowcharts and diagramming tools are essential for making data and workflows easy to understand. They help organisations make decisions and work more efficiently. These tools are really important in today's fast-paced business world.
Navigate Future Markets with Confidence: Insights from Spherical Insights LLP
The insights presented in this blog are derived from comprehensive market research conducted by Spherical Insights LLP, a trusted advisory partner to leading global enterprises. Backed by in-depth data analysis, expert forecasting, and industry-specific intelligence, our reports empower decision-makers to identify strategic growth opportunities in fast-evolving sectors. Clients seeking detailed market segmentation, competitive landscapes, regional outlooks, and future investment trends will find immense value in the full report. By leveraging our research, businesses can make informed decisions, gain a competitive edge, and stay ahead in the transition toward sustainable and profitable solutions.
Global Flowchart and Diagramming Tools Market Size & Statistics
- The Global Flowchart and Diagramming Tools Market Was Valued at Approximately USD 2.17 billion in 2024.
- The market is expected to grow at a CAGR of 16.88% between 2024 and 2035.
- The Global Flowchart and Diagramming Tools Market size is projected to reach approximately USD 12.07 billion by 2035.
- North America holds the largest revenue share, accounting for 40% of the market in 2024, driven by the rapid integration of AI-powered productivity suites and a high concentration of tech-driven enterprises.
- Asia-Pacific is the fastest-growing region, with a projected CAGR exceeding 12%, supported by digital transformation initiatives like India’s Business Reforms Action Plan (BRAP) and increasing cloud adoption across emerging economies.
Unlock exclusive market insights—Download the Brochure now and dive deeper into the future of the Flowchart and Diagramming Tools Market.
Regional Growth & Demand Analysis
North America continues to lead the flowchart and diagramming tools market in terms of revenue, accounting for half of the global share. Growth here is mainly driven by big companies and a well-established business environment that focuses on digital change. Companies in this area are quickly moving to using AI in their work tools and online collaboration platforms to manage workers who are not in the same place. Also, a lot of money is spent on research and development, and the early use of features like automated process mapping helps North American businesses keep their operations running smoothly and improves the quality of system documentation. Organisations here focus on transformation to stay ahead. American enterprises are key players in this growth. They are investing heavily in R&D to stay competitive. The use of AI-integrated productivity suites is becoming more common. This region's mature business ecosystem supports its growth. The high concentration of Fortune 500 companies also helps. Organisations are shifting toward native collaboration platforms. This shift helps them manage distributed workforces effectively.
Asia-Pacific is expected to witness the fastest growth during the forecast period, with a growth rate of over 12%. Countries such as India and China are getting benefits from digital projects, and many small and medium businesses are using cloud services. The government is also helping; for example, India's Business Reforms Action Plan is supporting businesses to use digital workflows to compete worldwide. Also, there are people with tech skills, and IT services are growing in the region, which is increasing the need for diagramming solutions that allow real-time collaboration across borders. India and China are leading this growth.
Global Flowchart and Diagramming Tools Market Segmentation
The Global Flowchart and Diagramming Tools Market is Segmented By Type (Cloud-Based, Web-Based, and On-Premise), By Offering (Software and Services), and By Enterprise Size (Small and Medium-sized Enterprises (SMEs) and Large Enterprises). It also includes key End-Use Verticals such as IT & Telecommunications, Healthcare, Education, BFSI (Banking, Financial Services, and Insurance), and Manufacturing. The report provides a comprehensive regional analysis across North America, Europe, Asia-Pacific, Latin America, and the Middle East & Africa, highlighting localised adoption trends and regulatory influences.
Ready to lead the Flowchart and Diagramming Tools Market
Discover the regional trends and growth factors shaping the industry. We’re here to assist with expert, personalized data.
Call +1 303 800 4326 or Send us a message for a personalized consultation.
Top 10 Trends in the Global Flowchart and Diagramming Tools Market
- Transition from Static Drawing to Generative AI Layout Automation
- Integration of Real-Time Multi-User Synchronisation in Cloud-Native Suites
- Widespread Adoption of Text-to-Diagram and Code-to-Chart Functionality
- Rise of Infinite Canvas Architectures for Non-Linear Visual Brainstorming
- Evolution toward Data-Linked Visuals with Dynamic Live-Stream Updates
- Mandatory Zero-Trust Security Protocols for Enterprise Diagram Governance
- Surge in Predictive Formatting and Intelligent Shape Suggestion Engines
- Development of Digital Twin Visualisation for Complex Systems Mapping
- Expansion of VR and AR Immersive Workspaces for Collaborative Design
- Transition from Standalone Software to Embedded Workflow Collaboration Hubs
Unlock exclusive market insights—Download the Brochure now and dive deeper into the future of the Flowchart and Diagramming Tools Market.
- Transition from Static Drawing to Generative AI Layout Automation
The diagramming process used to be a time-consuming task. People had to move and align every single shape and line. Now things are changing. We are moving towards using Generative AI models. These models can take text or data and turn it into a complete flowchart in no time. The reason for this change is that companies need to move. They want to reduce the amount of documentation they have to do. This is especially true in the tech industry, where things happen quickly. Companies are now using AI to handle the layout and design of diagrams. This means team members can focus on the stuff, like the overall plan and logic. They do not have to worry about making sure everything is perfectly aligned. Generative AI models are helping with this.
- Integration of Real-Time Multi-User Synchronisation in Cloud-Native Suites
In the past, version control was a major hurdle, with teams often circulating outdated PDF or image versions of a process map. The industry is now standardising on cloud-native synchronisation, where multiple contributors can edit a single living document simultaneously from different global locations. Driven by the permanent shift to hybrid work, this multiplayer approach ensures that every stakeholder sees the most current iteration of a project. This evolution eliminates the confusion of fragmented files and creates a synchronised environment where feedback is immediate and collaborative.
- Widespread Adoption of Text-to-Diagram and Code-to-Chart Functionality
Traditional diagramming required a visual-first mindset, which often alienated developers and data analysts who prefer working in text or code. We are currently seeing a surge in Diagrams as Code (DaC), where users write simple scripts (like Mermaid or PlantUML) that the software automatically renders into visual charts. This trend is fuelled by the DevOps movement, as it allows technical teams to store their diagrams in version control systems like GitHub alongside their source code. By treating visuals as text-based assets, organisations can ensure that system documentation stays as agile and up-to-date as the software it represents.
- Rise of Infinite Canvas Architectures for Non-Linear Visual Brainstorming
The old paradigm of page-based diagramming often restricted creative thinking to fixed dimensions, mirroring the limitations of physical paper. The market is moving toward infinite canvas architectures, providing a borderless workspace where teams can map out massive, non-linear ideas without running out of room. This trend is particularly popular in UX design and product management, where complex user journeys and ecosystem maps require vast, interconnected spaces. By removing the boundary of the slide or page, these tools foster more expansive brainstorming and allow for the consolidation of entire project lifetimes into a single visual hub.
- Evolution toward Data-Linked Visuals with Dynamic Live-Stream Updates
Static diagrams have long suffered from becoming obsolete the moment a business process changes or a data point shift. The current evolution focuses on data-linked visualisation, where flowchart elements are directly connected to live data sources like Excel, SQL databases, or live APIs. As the underlying data changes, the diagram updates its shapes, colours, or values in real-time without human intervention. This shift is essential for high-stakes industries like BFSI and logistics, where managers rely on these live dashboards to monitor system health and operational flows at a glance, turning a simple chart into a powerful decision-making tool.
Empower your strategic planning:
Stay informed with the latest industry insights and market trends to identify new opportunities and drive growth in the flowchart and diagramming tools market. To explore more in-depth trends, insights, and forecasts, please refer to our detailed report.
Top 30 Companies in the Global Flowchart and Diagramming Tools Market
- Lucid Software Inc. (Lucidchart)
- Microsoft Corporation (Visio)
- Miro
- Atlassian (Gliffy)
- Nulab Inc. (Cacoo)
- Creately (Cinergix)
- SmartDraw Software, LLC
- Diagrams.net (Draw.io)
- Wondershare (EdrawMax)
- Canva
- Visual Paradigm
- Balsamiq Studios, LLC
- The Omni Group (OmniGraffle)
- Whimsical
- Figma (FigJam)
- Slyy (Textografo)
- Mermaid Chart
- ClickUp
- Taskade
- MindMeister
- Panciera (yEd Graph Editor)
- Moqups
- Venngage
- Jotform
- AFFiNE
- Cloudcraft
- Terrastruct
- Sketch
- Zen Flowchart
- Pidoco
- Lucid Software Inc. (Lucidchart)
Headquarters: South Jordan, Utah, United States
Lucidchart stands as a dominant force in the intelligent diagramming space, moving beyond simple vector drawing to offer a data-driven visualisation platform. The company distinguishes itself through deep integrations with Google Workspace, Microsoft 365, and AWS, allowing technical teams to automatically generate architecture diagrams from live cloud data. In 2026, the platform will emphasise AI-assisted drafting, where users provide a text-based description of a process and the software renders a structured, formatted flowchart. This focus on automation and enterprise-grade security made it a standard for organisations managing complex IT infrastructures and scaled agile frameworks.
- Microsoft Corporation (Visio)
Headquarters: Redmond, Washington, United States
As one of the longest-standing entities in the sector, Microsoft Visio maintains a massive footprint by leveraging the ubiquity of the Microsoft 365 ecosystem. While it remains the go-to choice for detailed engineering schematics and floor plans due to its vast library of industry-standard stencils, the company recently pivoted toward a web-first strategy. By embedding Visio capabilities directly into Microsoft Teams and Excel, it lowered the barrier for non-technical users to create and share professional diagrams. Its recent updates focus on data linking, where a change in an Excel spreadsheet or a Power Automate flow triggers an instantaneous update in the corresponding Visio diagram.
- Miro
Headquarters: San Francisco, California, United States & Amsterdam, Netherlands
Miro redefined the market by shifting the focus from structured flowcharting to expansive, collaborative whiteboarding. It provides an infinite canvas that serves as a central hub for distributed teams to conduct synchronous brainstorming, sprint planning, and workshop facilitation. In early 2026, Miro introduced advanced AI workflows that can instantly cluster sticky notes by theme or convert a messy group of sketches into a polished sequence of process steps. Its strength lies in its all-in-one approach, blending video conferencing, voting tools, and timers directly into the diagramming environment to keep high-growth startups and global creative agencies aligned.
- Atlassian (Gliffy)
Headquarters: Sydney, Australia
Gliffy, a vital component of the Atlassian ecosystem, is designed specifically for teams that live in Jira and Confluence. Its primary value proposition is the seamless documentation of technical workflows directly within project management tickets and internal wikis. Because it functions as an integrated add-on, it eliminates the need for users to switch between different browser tabs or applications to update a system architecture or a software release plan. This deep integration makes it highly popular among DevOps and software development teams who require version-controlled, collaborative diagrams that are inherently linked to their coding tasks and documentation.
- Nulab Inc. (Cacoo)
Headquarters: Fukuoka, Japan
Nulab’s Cacoo positions itself as a streamlined, user-friendly alternative focused on real-time teamwork and multi-user editing. It is particularly well-regarded for its ease of use in wireframing and UI/UX design, providing a low learning curve for marketing and product teams. The software offers a robust set of templates for SWOT analyses, sitemaps, and network topologies that can be shared via secure, live URLs. By integrating closely with Nulab’s project management tool, Backlog, Cacoo provides a cohesive visual layer to the development lifecycle, ensuring that design changes are immediately visible to the developers responsible for implementation.
Unlock exclusive market insights—Download the Brochure now and dive deeper into the future of the Flowchart and Diagramming Tools Market.
Are you ready to discover more about the flowchart and diagramming tools market?
The report provides an in-depth analysis of the leading companies operating in the global flowchart and diagramming tools market. It includes a comparative assessment based on their product portfolios, business overviews, geographical footprint, strategic initiatives, market segment share, and SWOT analysis. Each company is profiled using a standardised format that includes:
Company Profiles
- Lucid Software Inc. (Lucidchart)
- Business Overview
- Company Snapshot
- Products Overview
- Company Market Share Analysis
- Company Coverage Portfolio
- Financial Analysis
- Recent Developments
- Merger and Acquisitions
- SWOT Analysis
- Microsoft Corporation (Visio)
- Miro
- Atlassian (Gliffy)
- Nulab Inc. (Cacoo)
- Creately (Cinergix)
- SmartDraw Software, LLC
- Diagrams.net (Draw.io)
- Wondershare (EdrawMax)
- Canva
- Visual Paradigm
- Balsamiq Studios, LLC
- The Omni Group (OmniGraffle)
- Whimsical
- Figma (FigJam)
- Slyy (Textografo)
- Mermaid Chart
- ClickUp
- Taskade
- MindMeister
- Panciera (yEd Graph Editor)
- Moqups
- Venngage
- Jotform
- AFFiNE
- Cloudcraft
- Terrastruct
- Sketch
- Zen Flowchart
- Pidoco
Conclusion
The flowchart and diagramming tools market is changing a lot right now. It is moving away from being a simple tool for drawing pictures. Now it is becoming an important part of how companies work. The way people used to make diagrams by dragging shapes is being replaced by artificial intelligence that can do things on its own. This is a change, and companies will be successful if they can use this automated intelligence to make their businesses work better. North America is still a leader in this area because it started using these tools, and they have a lot of technology infrastructure. The Asia-Pacific region is growing very fast. This is because many countries in this region are trying to become more digital, and there are small businesses that are using cloud computing. The old way of making documents is being replaced by new tools that can update automatically. These tools can show how a company is doing in terms of time. The flowchart and diagramming tools market is really changing with the rise of infinite canvases and live-data synchronisation. The flowchart and diagramming tools market is becoming more important, with dynamic and self-updating maps that show the health of an organisation.
Unlock exclusive market insights—Download the Brochure now and dive deeper into the future of the Flowchart and Diagramming Tools Market.
About the Spherical Insights & Consulting
Spherical Insights & Consulting is a market research and consulting firm which provides actionable market research study, quantitative forecasting and trends analysis provides forward-looking insight especially designed for decision makers and aids ROI. Which is catering to different industry such as financial sectors, industrial sectors, government organizations, universities, non-profits and corporations. The company's mission is to work with businesses to achieve business objectives and maintain strategic improvements.
CONTACT US:
For More Information on Your Target Market, Please Contact Us Below:
Phone: +1 303 800 4326 (the U.S.)
Phone: +91 90289 24100 (APAC)
Email: inquiry@sphericalinsights.com, sales@sphericalinsights.com
Contact Us: https://www.sphericalinsights.com/contact-us
Need help to buy this report?